white noise, pink noise, blue noise

white noise, pink noise, blue noise
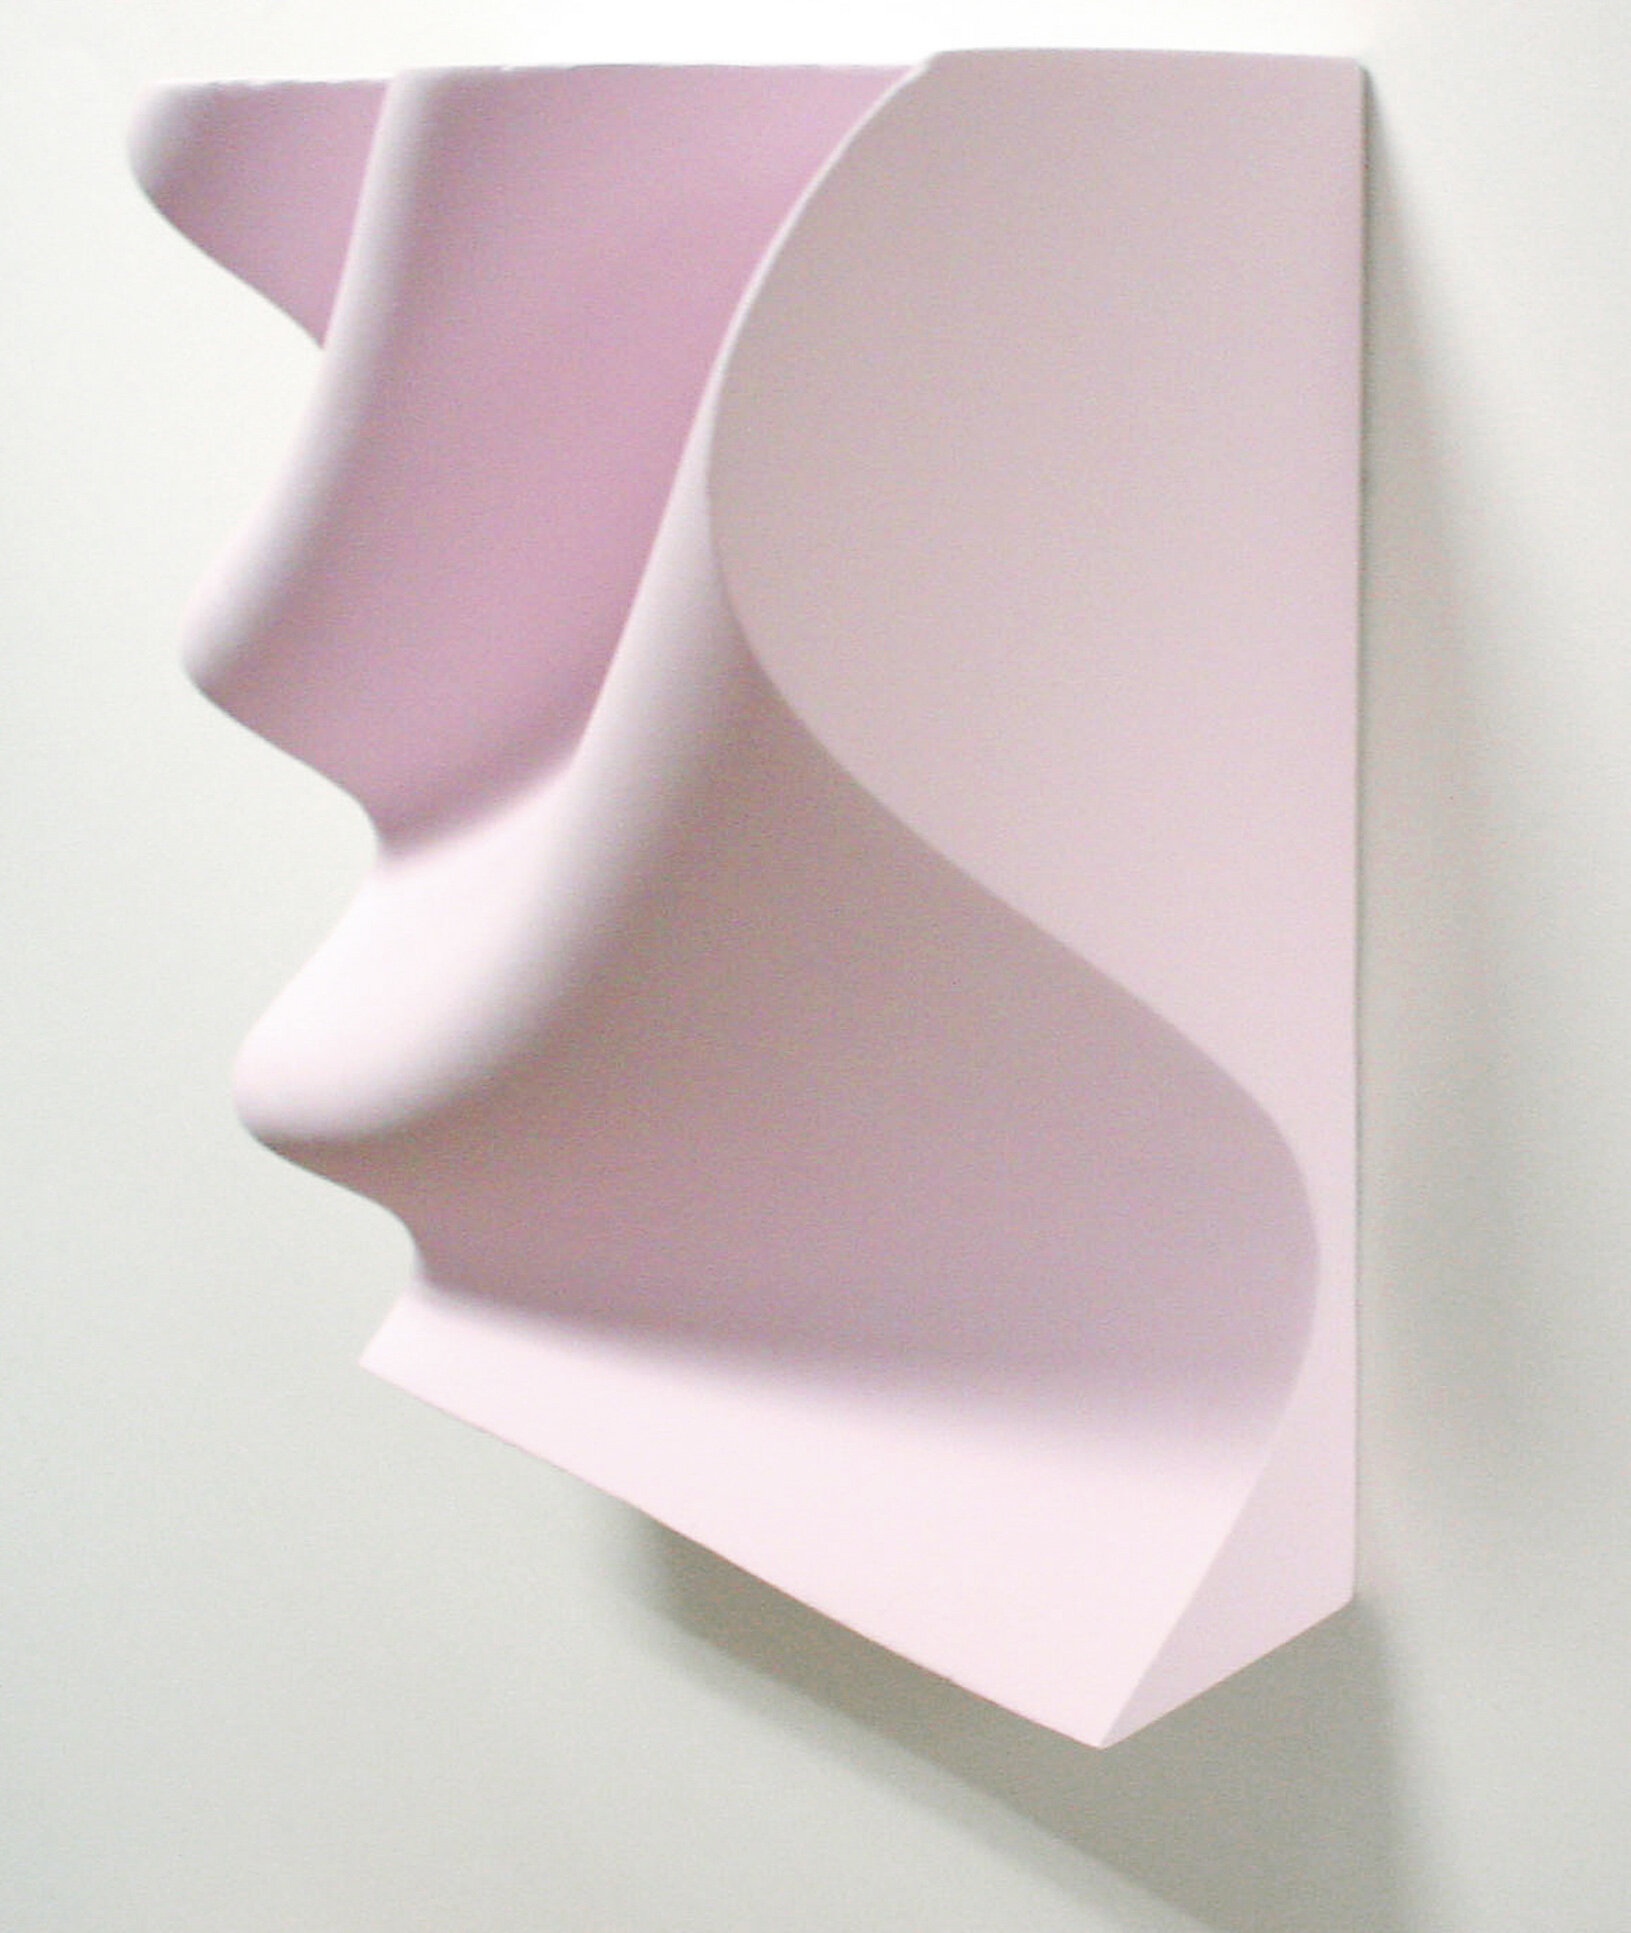
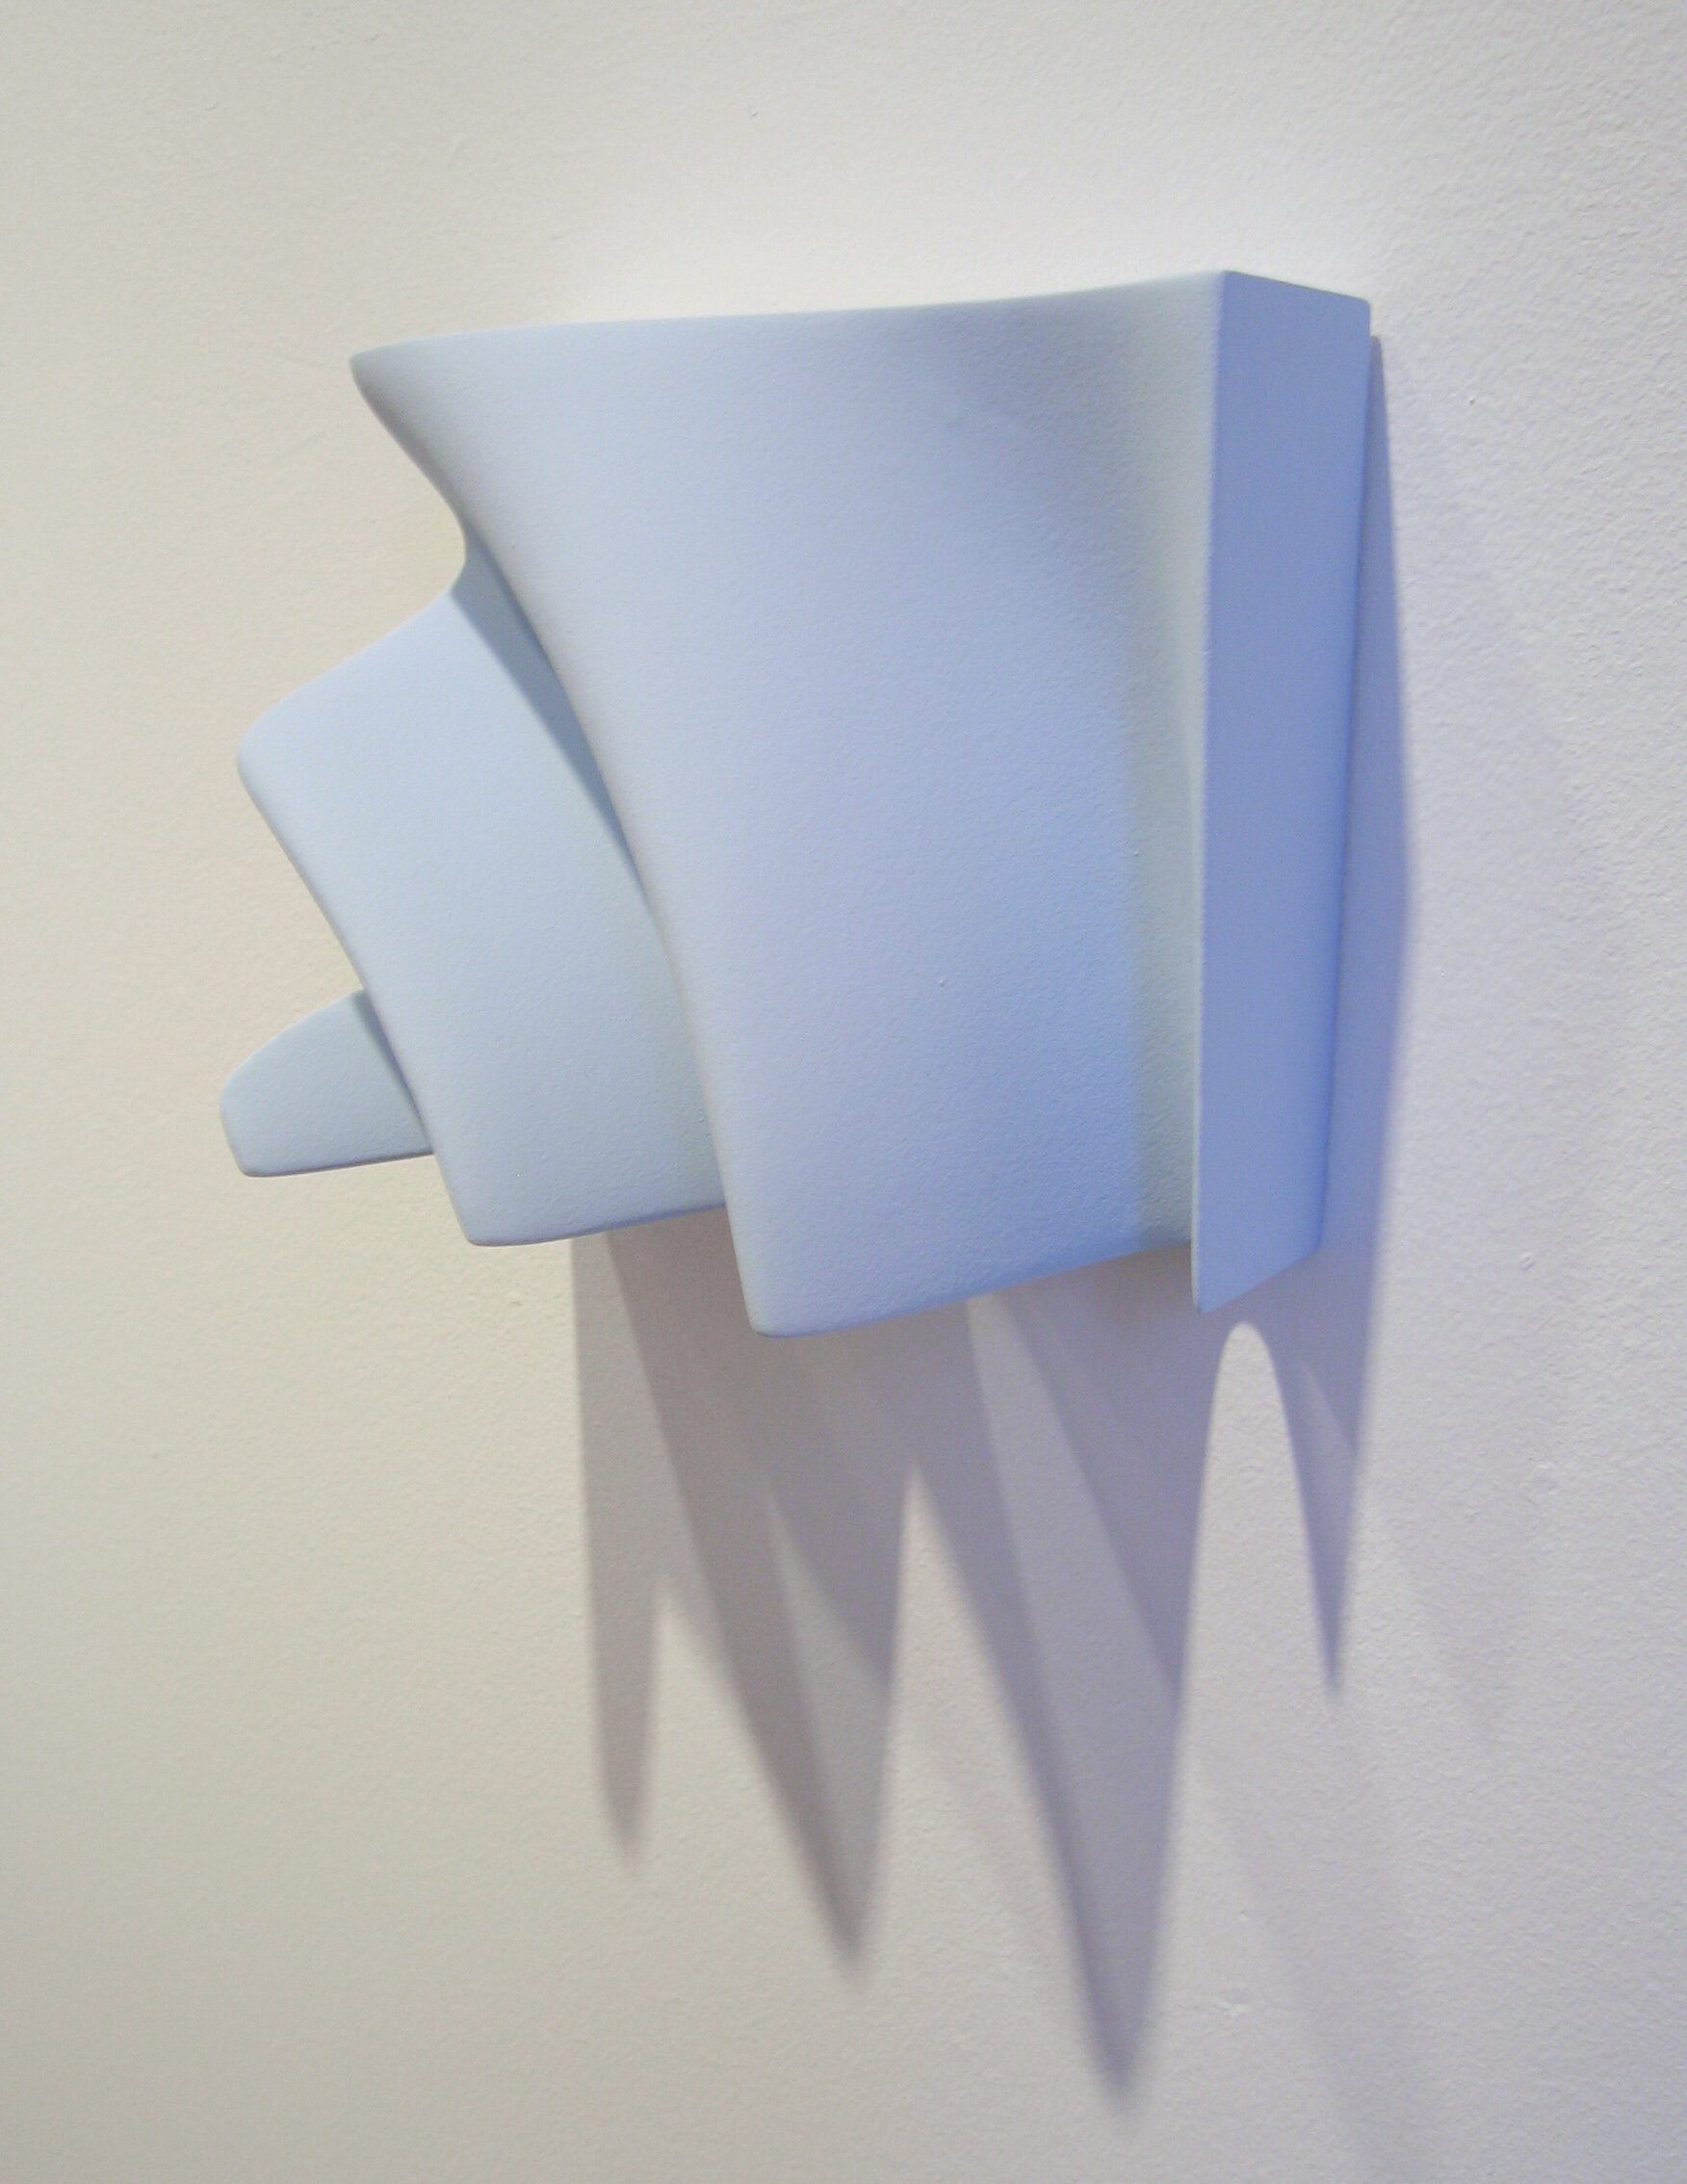
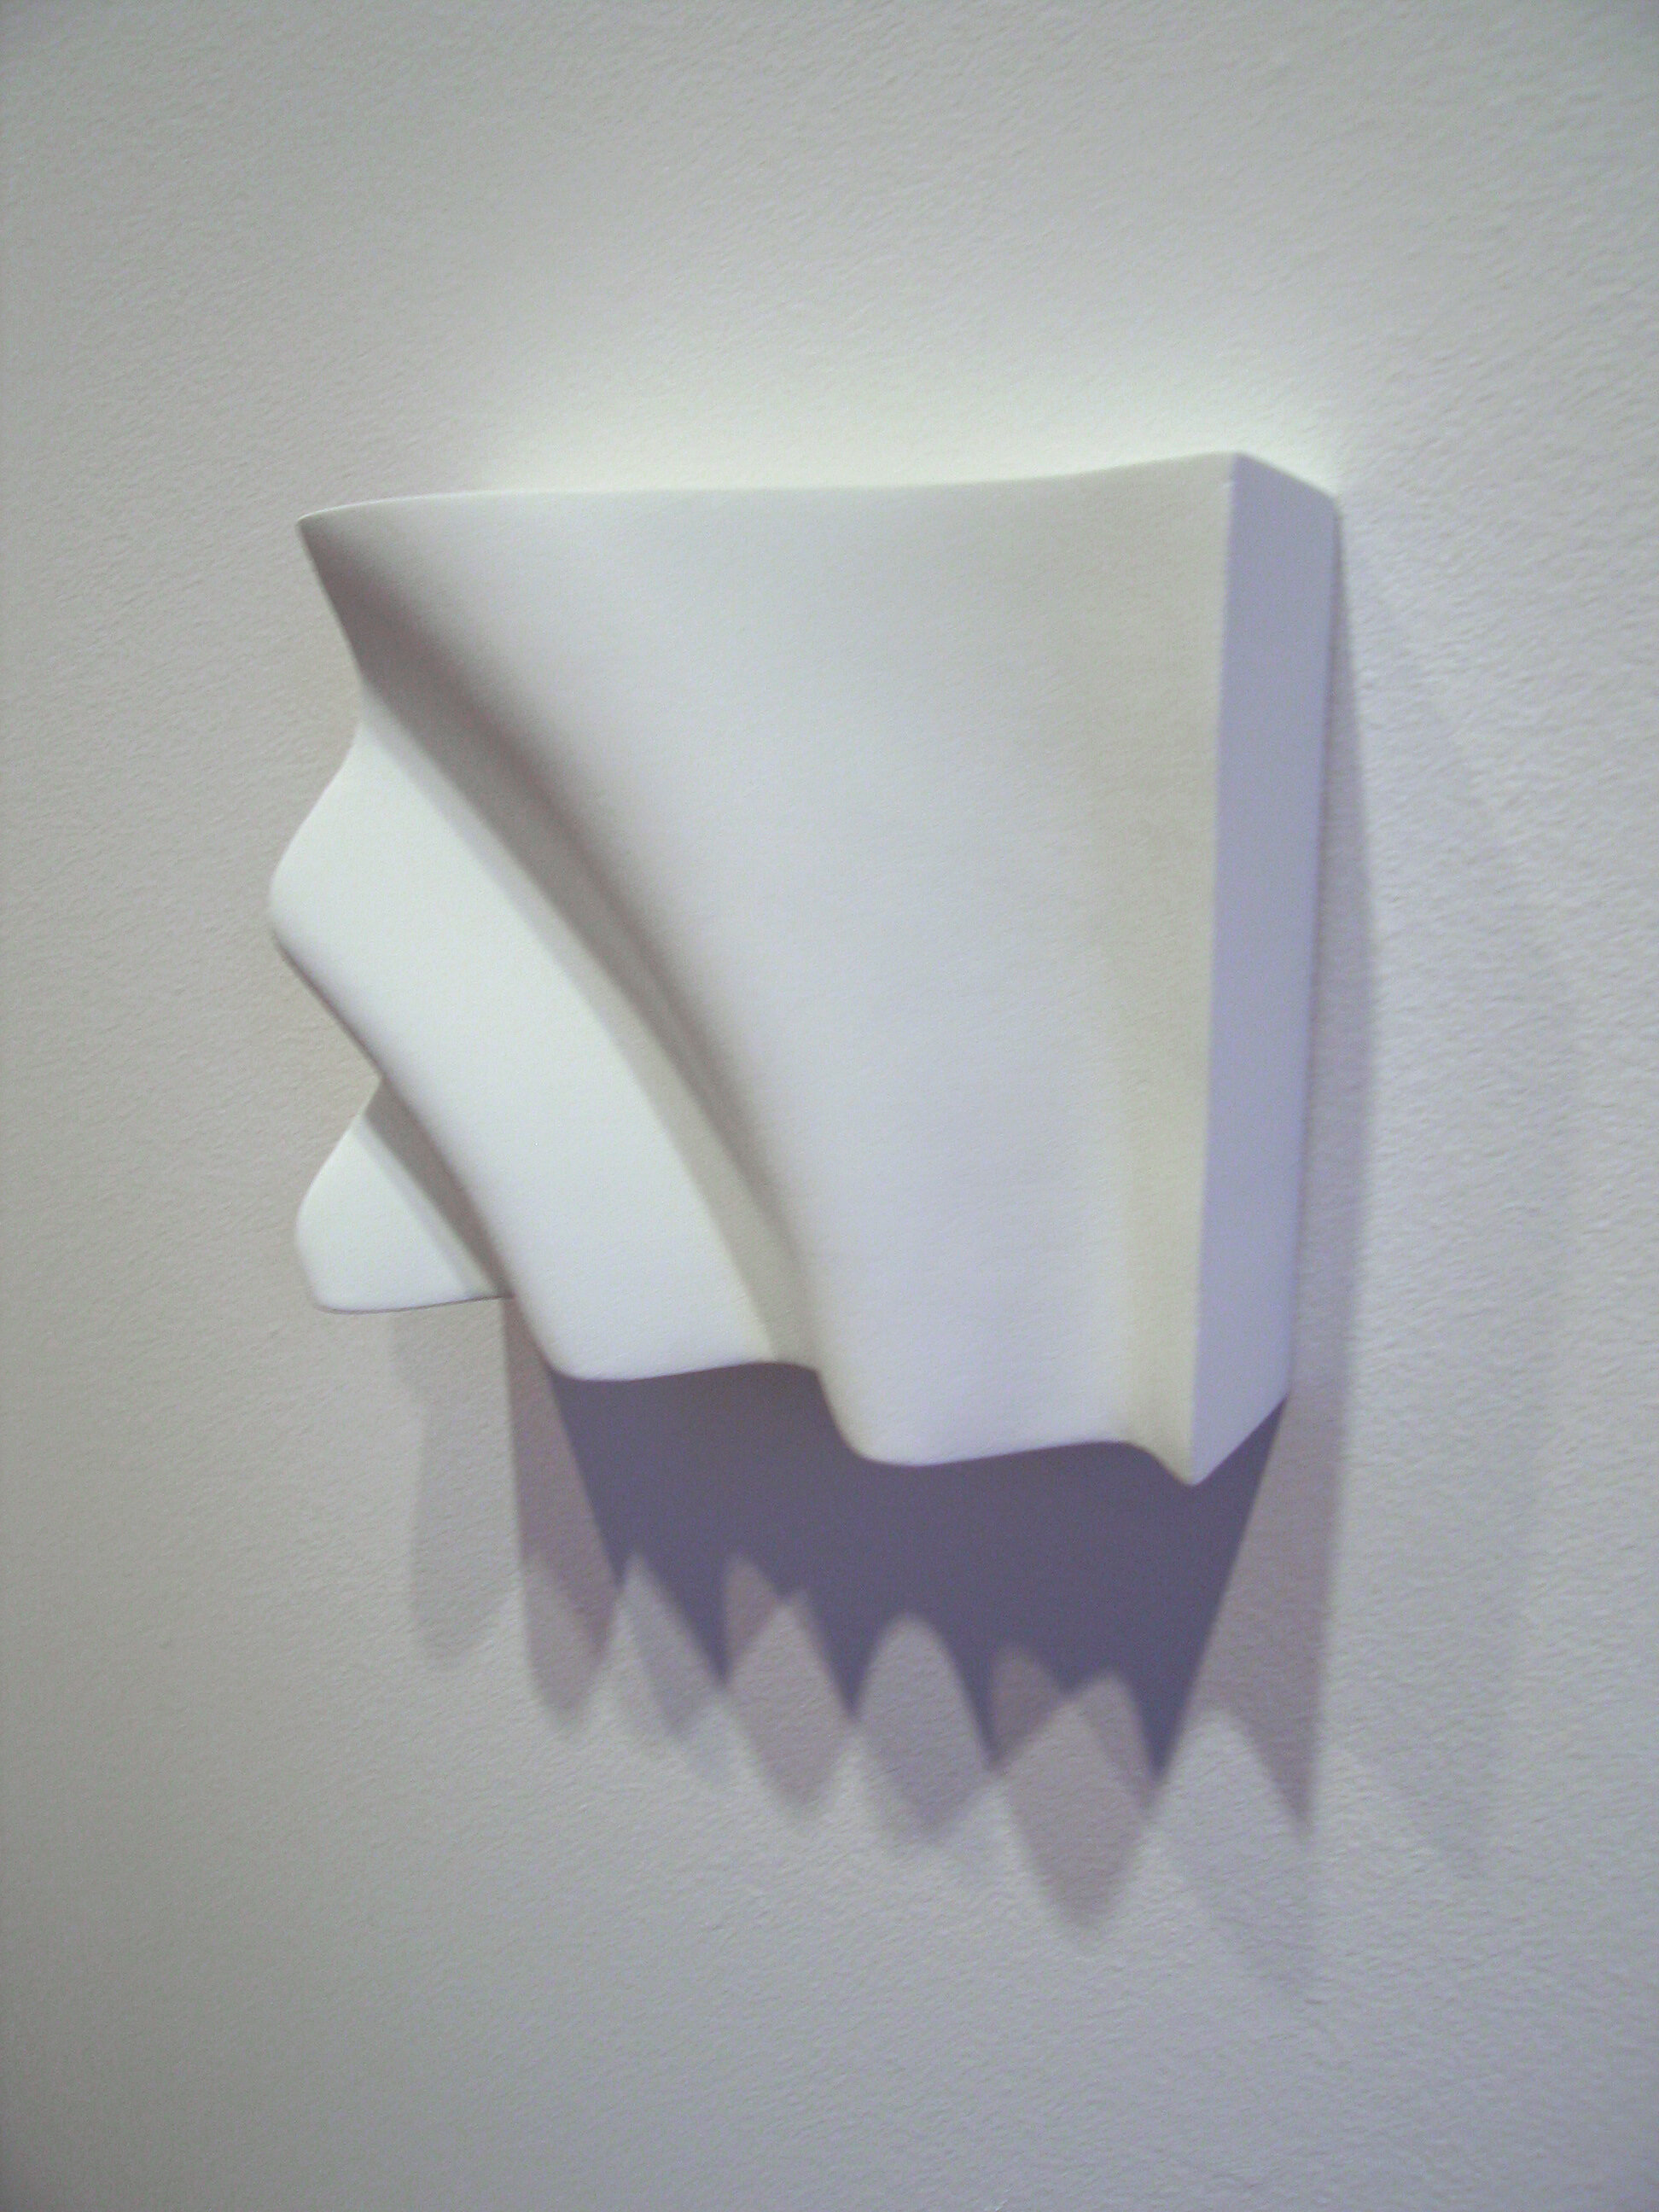
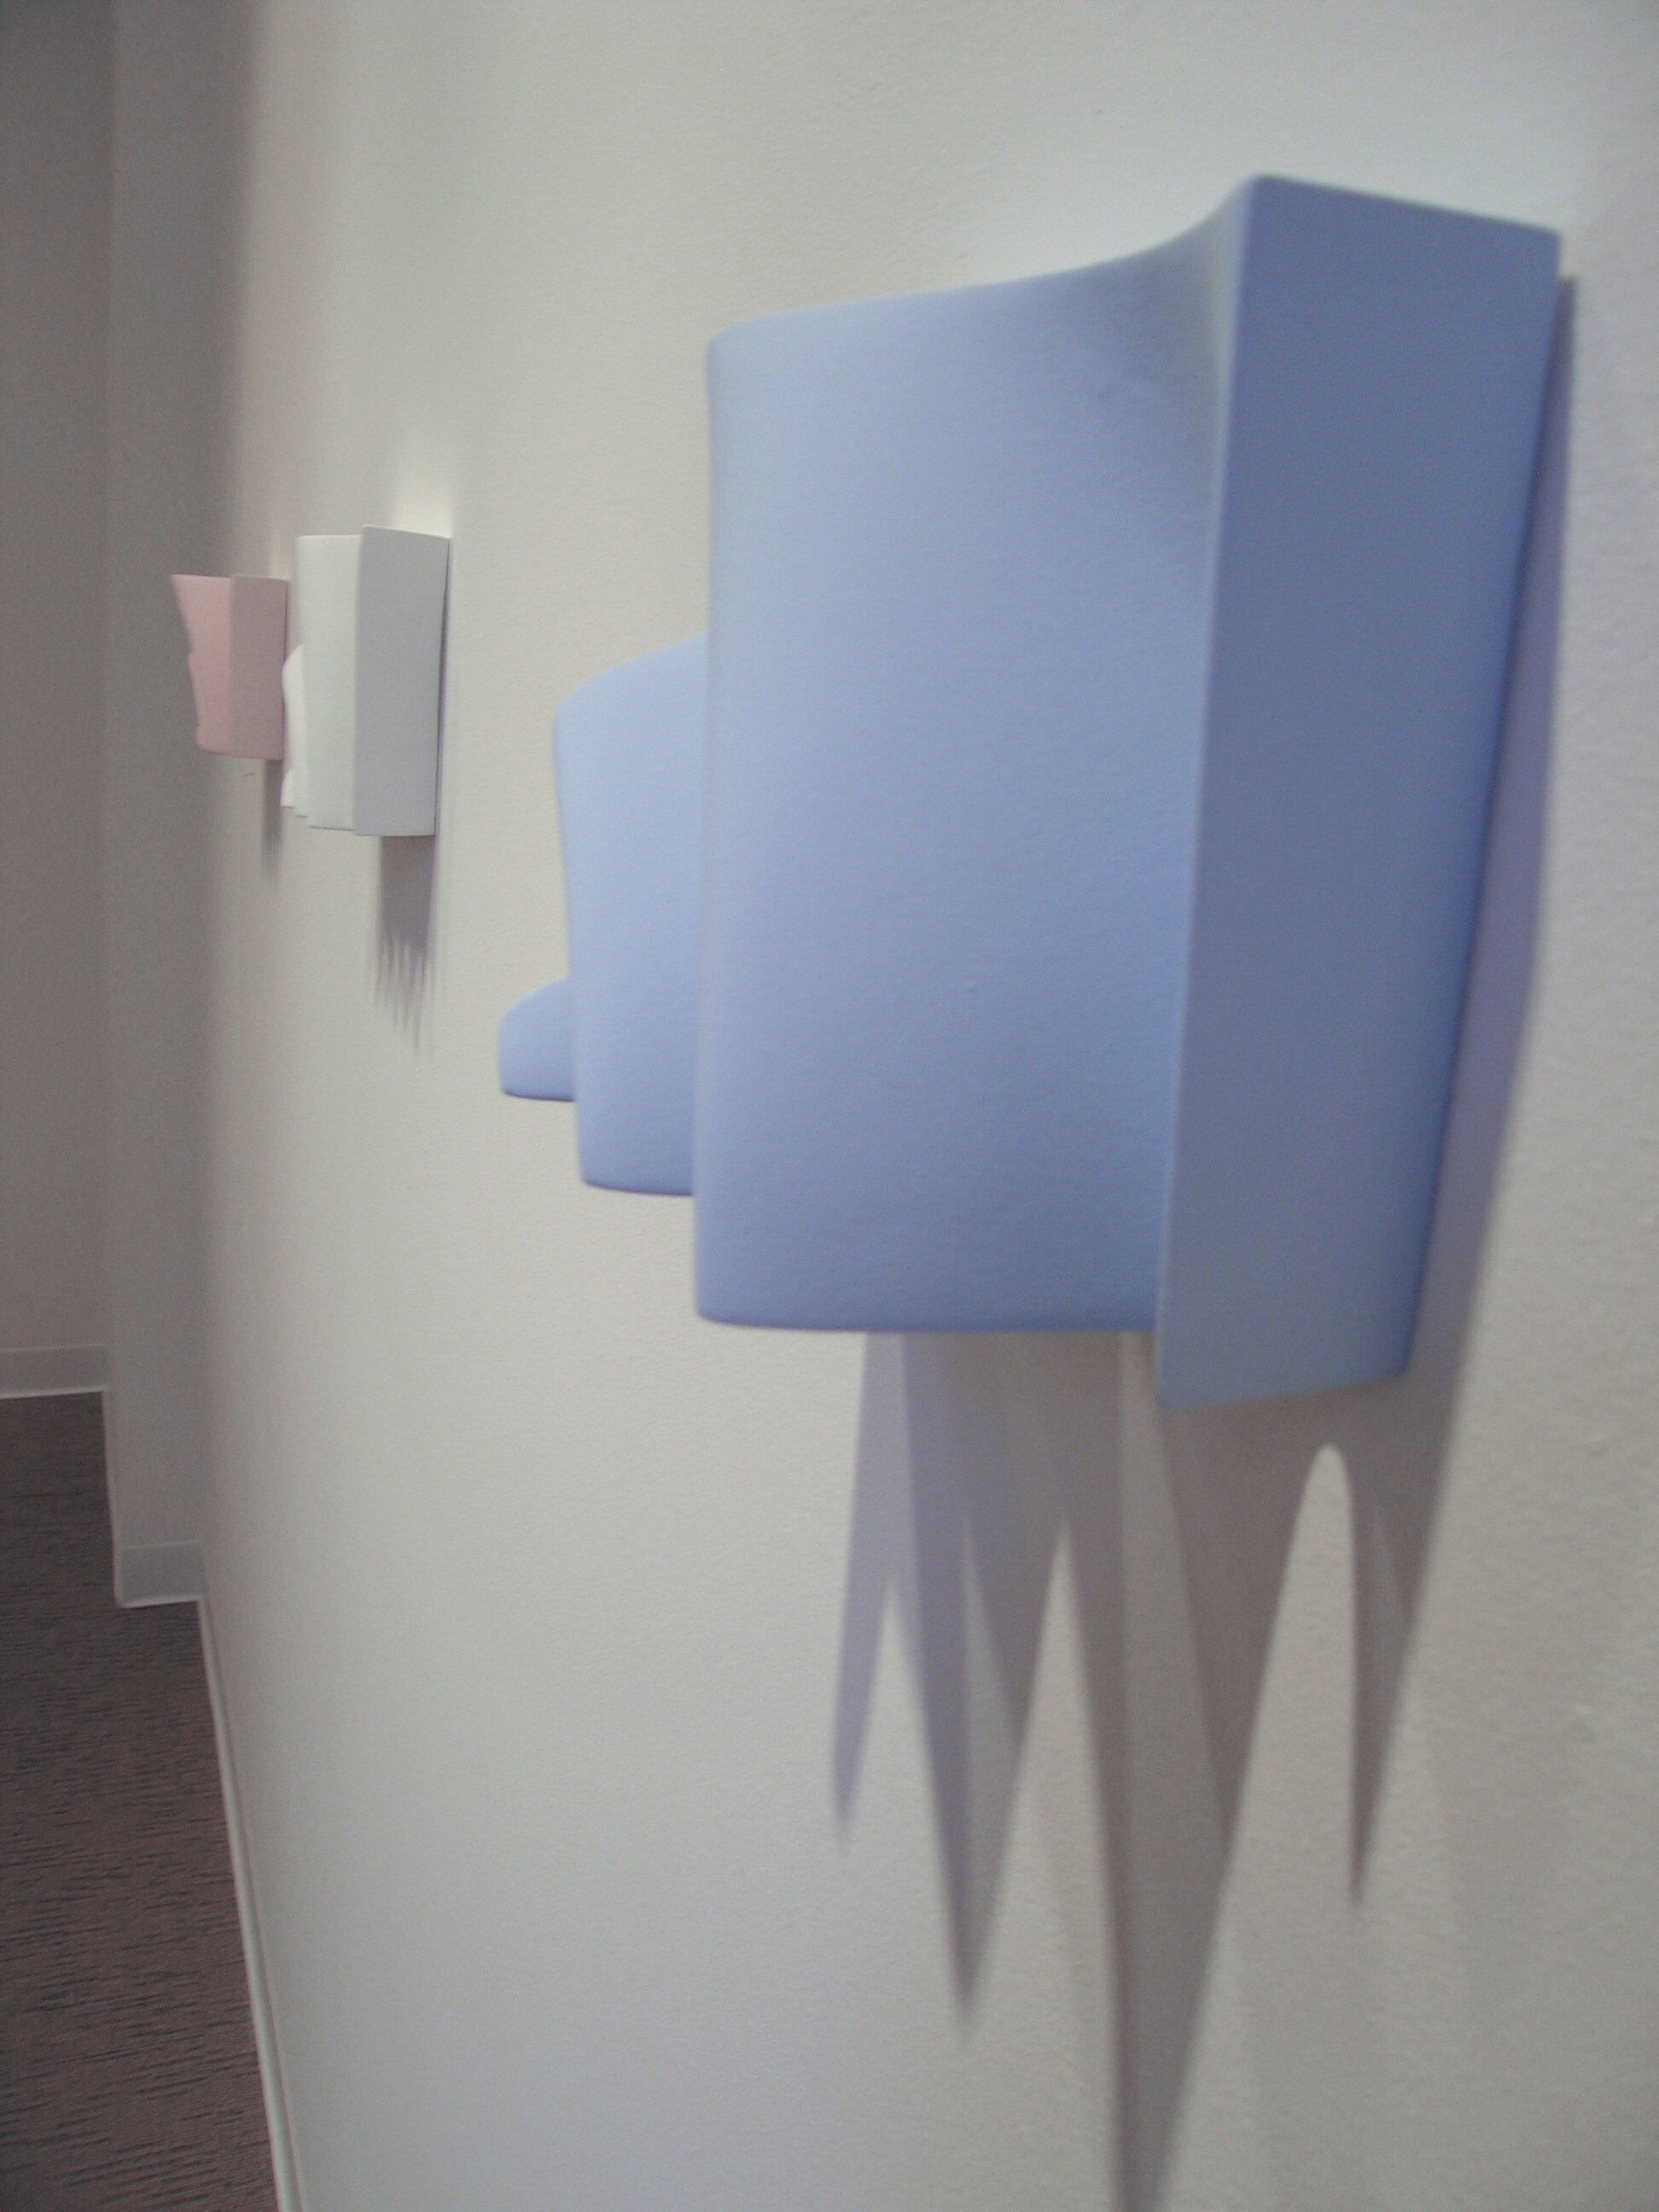
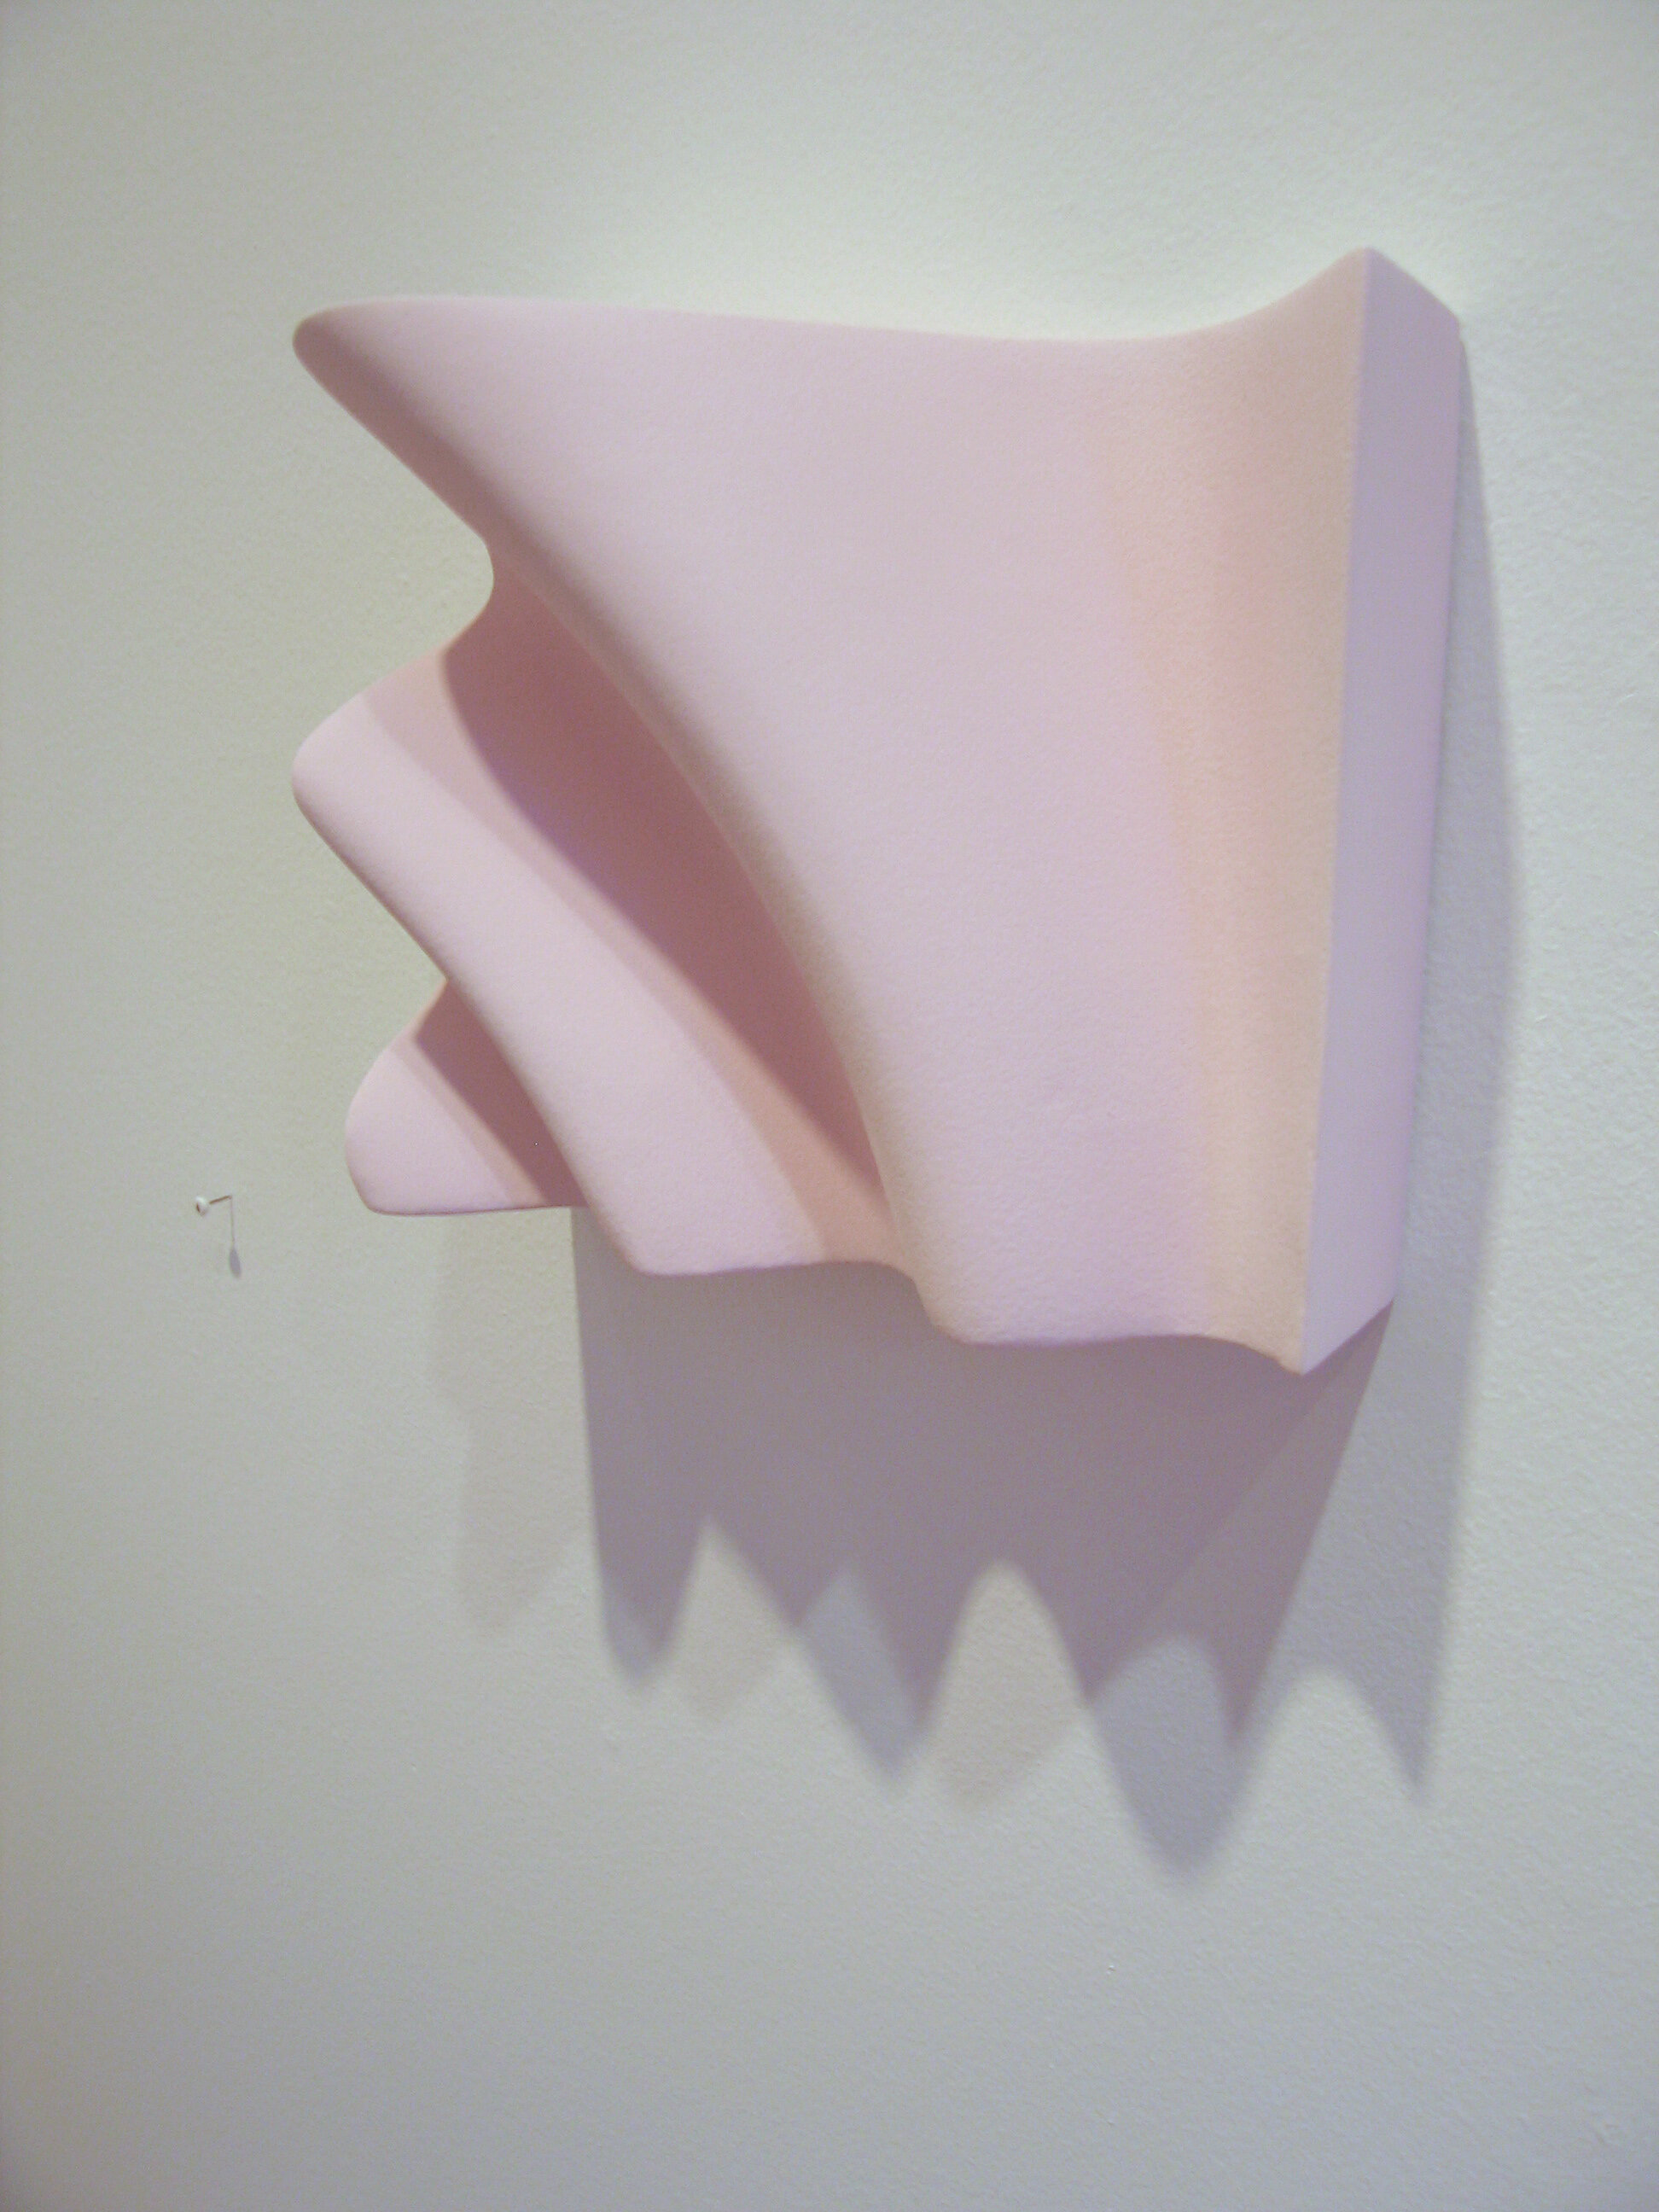
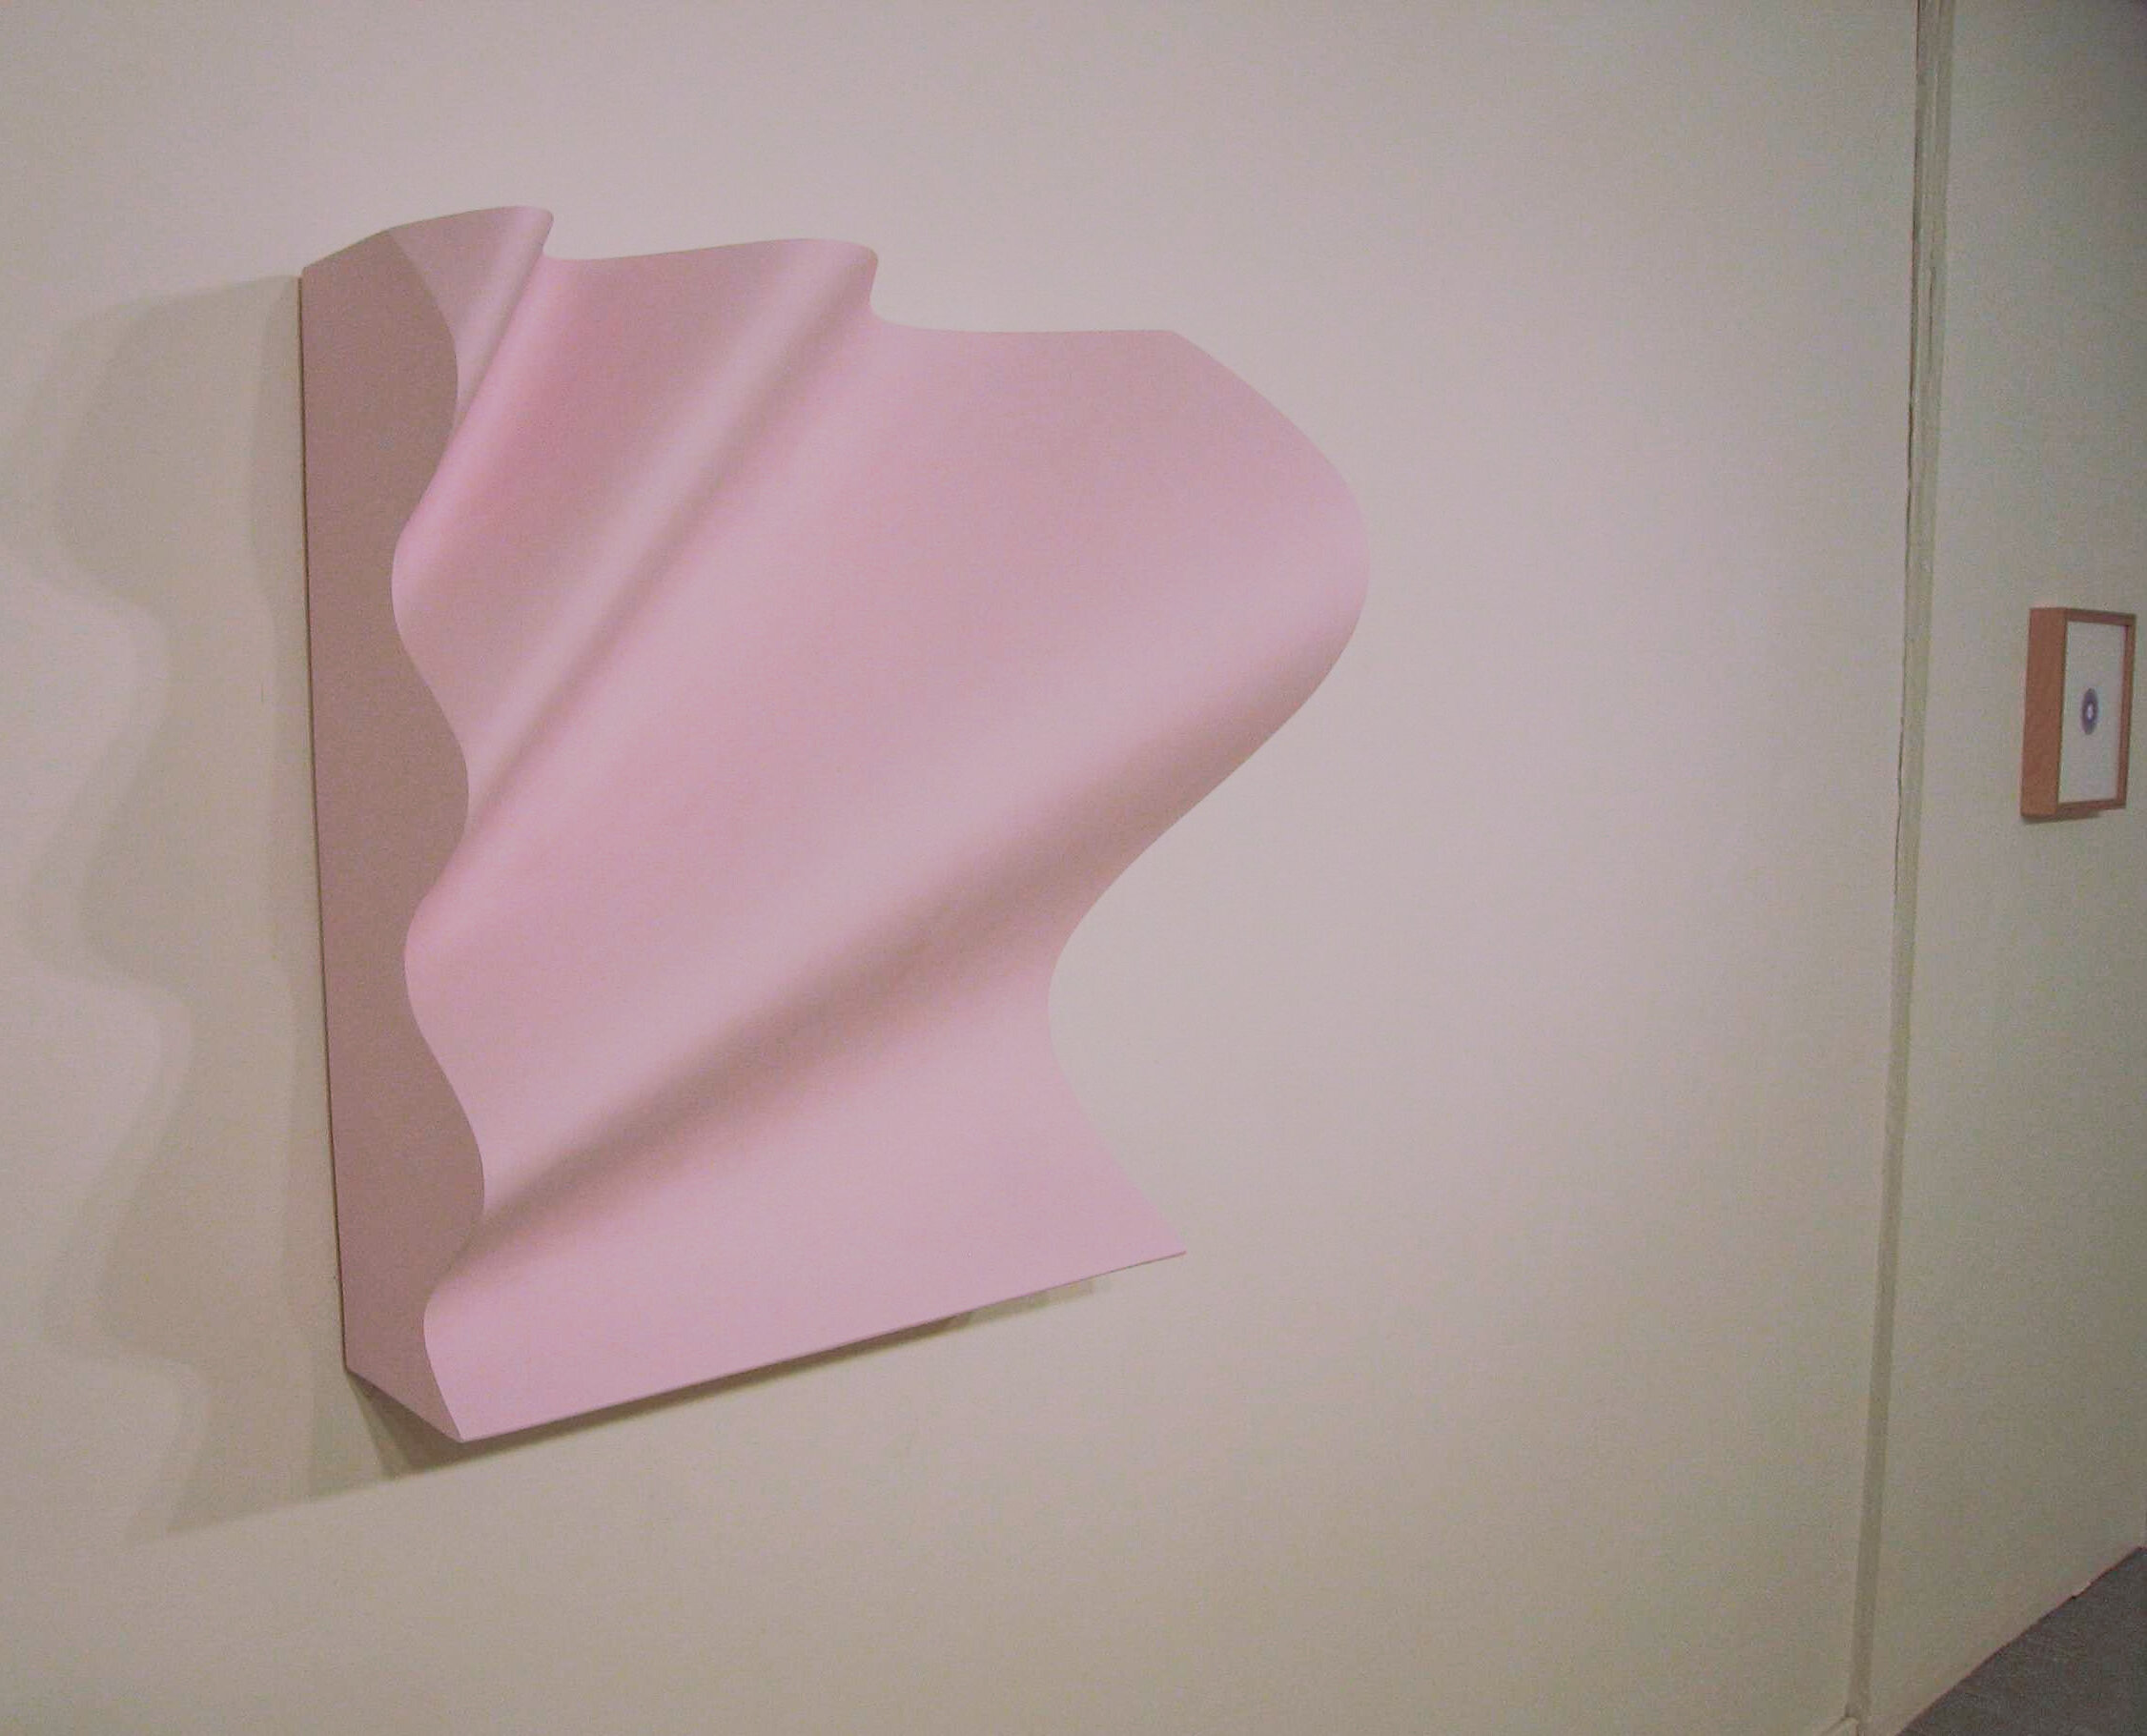
3D frequency probability maps painted fiberglass/plaster over chipboard/foam
2004, 2006
These sculptures are probability maps of frequency per the audible range (20-20K Hz) of white, pink and blue noise. White noise has an equal probability distribution of every frequency over the entire audible range (represented at 1 dB amplitude). At this scale, pink noise has a logarithmic increase (of probability) of 3 dB per every one octave decrease. Blue noise is the mathematic opposite of pink noise; an increase (of probability) of 3dB per every one octave increase over the same range.